Ultimate Forex Scalping Strategy Using Macd & Stochastic Oscillator
As a trader spending hours on hours per week looking at charts, you start to develop a technical vision which unconsciously lets you see cardinal points in the market, overlooked by the untrained eye.
For several years, I have been following a certain pattern in the market which produces over 80% winning trades every time I apply it.
Understanding the Indicators
My belief is that even a trader who uses technical analysis must understand the basics of the indicator he uses in his day to day trading.
The MACD Indicator
The MACD indicator is considered by many, including myself, to be one of the most reliable of all the existing indicators in technical analysis—when used correctly (which is what I’m here for). developed by Gerald Appel, who is considered a classic technical analysis guru.
The MACD indicator consists of 2 moving averages and a histogram
This is what it looks like:
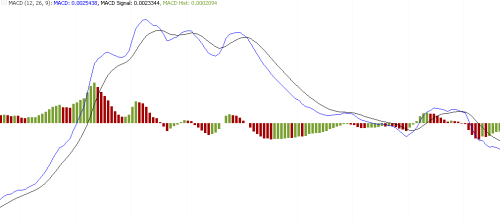
The BLUE average is the short period average and the BLACK average is the long period average.
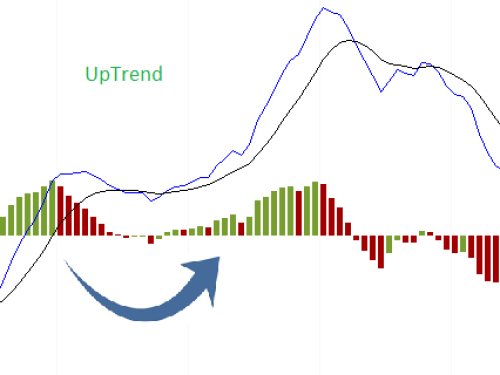
When the histogram is above zero level, the currency is on an uptrend.
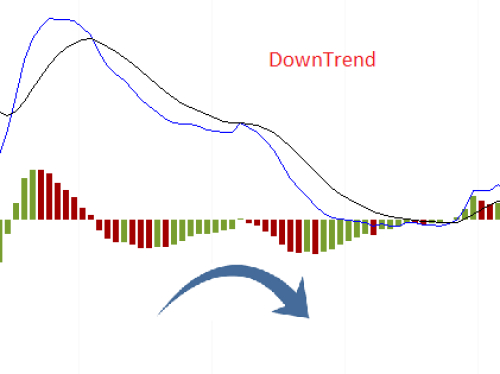
When the histogram is below zero level, the currency is on a downtrend.
For a long trade, we want the histogram to:
-Be above zero level.
-Then we want it to start declining towards the zero level.
-After it nears the zero level, we want it to reverse and go up again.
This situation indicates that the market is on its way to a reliable uptrend, one that will allow us to join it.
An example
For a short trade, we want the histogram to:
-Be below zero level.
-Then we want it to start rising towards the zero level.
-After it nears the zero level we want it to reverse and go down again.
This situation indicates that the market is on its way to a reliable downtrend, one that will allow us to join it.
An example
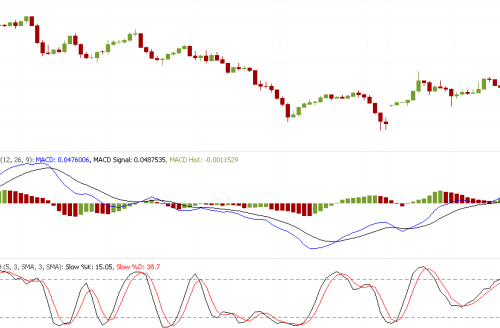
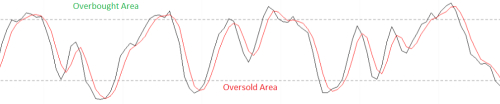
The Stochastic Oscillator
This indicator will help us with making a final confirmation of this trade and it will determine the exact point to enter it.
I’ve included the Stochastic with the Pips Carrier template, and this is what it looks like:
Everybody who is a trader familiar with these two indicators and knows so well how to apply it. But my Point of view is to how to make a perfect setup using these two indicators.
Executing Trades – Long Trades
After we’ve learnt about these two indicators, let’s see exactly how we should execute trades. I’m going to divide this explanation into the two possible scenarios:
1. Entry for buy (long)
2. Entry for sell (short)
How should we enter a long (buy) trade?
1. A turning point on the MACD histogram.
2. we need it to be on the oversold area we want the two lines to cross each other and we want the lines to face up.
3. As soon as the candlestick is closed, we should enter this trade.
Let’s analyze a long trade example:
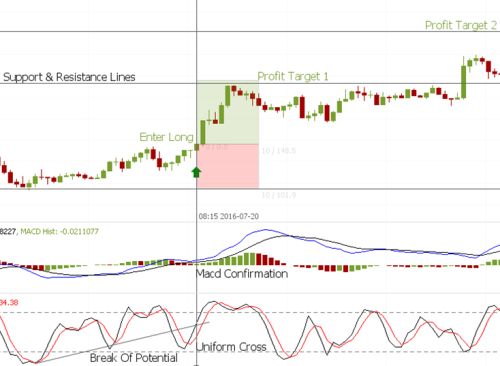
In this example we can clearly see that the histogram is facing up again and that the Stochastic lines have crossed each other on the oversold level, on their way up.
Note-
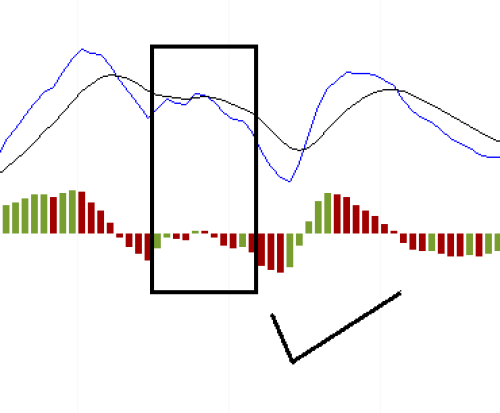
There’s a very important point I would like to add. It refers to a situation where the histogram is above level 0 and declines below level 0.
If it happens (i.e., if it declines below level 0), it has to reverse and return immediately above this level on the next bar in order for this to be a valid trade setup.
For example:
Now that we understand how to enter a long trade, the next step is managing it correctly.
Trade Management for a Long Trade
We place the stop loss at the nearest support & resistance levels.
First Take Profit Target
My first take profit goal is to set a profit target of Nearest Resistance data available from previous moves of market.
Second Take Profit Target
After the first part of the trade is in profit and will set stop loss to zero pip and hold the trade up to next level of resistance or hold the trade and wait for the fundamental effect of a news for more pips in favor.
In other hand trade may hit stop loss of zero. Which is simply mean by no Profit no loss.
Executing Trades – Short Trades
How should we enter a short (sell) trade?
1. A turning point on the MACD histogram.
2. we need it to be on the overbought area. we want the two lines to cross each other; and we want the lines to face down.
3. As soon as the candlestick is closed, we should enter this short sell trade.
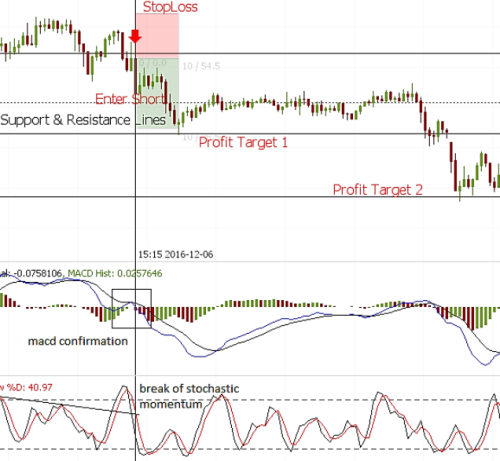
This is an example of a short sell trade:
Trade Management for a Short Trade
We place the stop loss at the nearest support & resistance levels.
First Take Profit Target
My first take profit goal is to set a profit target of Nearest Resistance data available from previous moves of market.
Second Take Profit Target
After the first part of the trade is in profit and will set stop loss to zero pip and hold the trade up to next level of resistance or hold the trade and wait for the fundamental effect of a news for more pips in favor.
In other hand trade may hit stop loss of zero. Which is simply mean by no Profit no loss.
Best Time Frame
You can use 15M & 1h for the best Resullt especially 15M. You can also apply it on 1H chart for scalping but do not go for other higher time frames. For this reason, applying strategy over a higher time frame is ineffective because the number of trades and trade management is influenced and the setup become very-very rare.
Best Currency Pair
All the figures above are made using GBP based currency pairs specially GBP/JPY. After many hours of backtesting i realized that GBP based pairs are more effective. You can apply the strategy on EUR/USD also but the entry rules for stochstic observation may be different.
The Bottom Line
As with any specialty, it takes time and practice to become better at using strategy in forex trading. Don't allow yourself to become frustrated; the long-term rewards definitely outweigh the costs. Follow the simple rules of applying the setup and learn from these common mistakes to help you analyze profitable opportunities in the currency market
For several years, I have been following a certain pattern in the market which produces over 80% winning trades every time I apply it.
Understanding the Indicators
My belief is that even a trader who uses technical analysis must understand the basics of the indicator he uses in his day to day trading.
The MACD Indicator
The MACD indicator is considered by many, including myself, to be one of the most reliable of all the existing indicators in technical analysis—when used correctly (which is what I’m here for). developed by Gerald Appel, who is considered a classic technical analysis guru.
The MACD indicator consists of 2 moving averages and a histogram
This is what it looks like:
The BLUE average is the short period average and the BLACK average is the long period average.
When the histogram is above zero level, the currency is on an uptrend.
When the histogram is below zero level, the currency is on a downtrend.
For a long trade, we want the histogram to:
-Be above zero level.
-Then we want it to start declining towards the zero level.
-After it nears the zero level, we want it to reverse and go up again.
This situation indicates that the market is on its way to a reliable uptrend, one that will allow us to join it.
An example
For a short trade, we want the histogram to:
-Be below zero level.
-Then we want it to start rising towards the zero level.
-After it nears the zero level we want it to reverse and go down again.
This situation indicates that the market is on its way to a reliable downtrend, one that will allow us to join it.
An example
The Stochastic Oscillator
This indicator will help us with making a final confirmation of this trade and it will determine the exact point to enter it.
I’ve included the Stochastic with the Pips Carrier template, and this is what it looks like:
Everybody who is a trader familiar with these two indicators and knows so well how to apply it. But my Point of view is to how to make a perfect setup using these two indicators.
Executing Trades – Long Trades
After we’ve learnt about these two indicators, let’s see exactly how we should execute trades. I’m going to divide this explanation into the two possible scenarios:
1. Entry for buy (long)
2. Entry for sell (short)
How should we enter a long (buy) trade?
1. A turning point on the MACD histogram.
2. we need it to be on the oversold area we want the two lines to cross each other and we want the lines to face up.
3. As soon as the candlestick is closed, we should enter this trade.
Let’s analyze a long trade example:
In this example we can clearly see that the histogram is facing up again and that the Stochastic lines have crossed each other on the oversold level, on their way up.
Note-
There’s a very important point I would like to add. It refers to a situation where the histogram is above level 0 and declines below level 0.
If it happens (i.e., if it declines below level 0), it has to reverse and return immediately above this level on the next bar in order for this to be a valid trade setup.
For example:
Now that we understand how to enter a long trade, the next step is managing it correctly.
Trade Management for a Long Trade
We place the stop loss at the nearest support & resistance levels.
First Take Profit Target
My first take profit goal is to set a profit target of Nearest Resistance data available from previous moves of market.
Second Take Profit Target
After the first part of the trade is in profit and will set stop loss to zero pip and hold the trade up to next level of resistance or hold the trade and wait for the fundamental effect of a news for more pips in favor.
In other hand trade may hit stop loss of zero. Which is simply mean by no Profit no loss.
Executing Trades – Short Trades
How should we enter a short (sell) trade?
1. A turning point on the MACD histogram.
2. we need it to be on the overbought area. we want the two lines to cross each other; and we want the lines to face down.
3. As soon as the candlestick is closed, we should enter this short sell trade.
This is an example of a short sell trade:
Trade Management for a Short Trade
We place the stop loss at the nearest support & resistance levels.
First Take Profit Target
My first take profit goal is to set a profit target of Nearest Resistance data available from previous moves of market.
Second Take Profit Target
After the first part of the trade is in profit and will set stop loss to zero pip and hold the trade up to next level of resistance or hold the trade and wait for the fundamental effect of a news for more pips in favor.
In other hand trade may hit stop loss of zero. Which is simply mean by no Profit no loss.
Best Time Frame
You can use 15M & 1h for the best Resullt especially 15M. You can also apply it on 1H chart for scalping but do not go for other higher time frames. For this reason, applying strategy over a higher time frame is ineffective because the number of trades and trade management is influenced and the setup become very-very rare.
Best Currency Pair
All the figures above are made using GBP based currency pairs specially GBP/JPY. After many hours of backtesting i realized that GBP based pairs are more effective. You can apply the strategy on EUR/USD also but the entry rules for stochstic observation may be different.
The Bottom Line
As with any specialty, it takes time and practice to become better at using strategy in forex trading. Don't allow yourself to become frustrated; the long-term rewards definitely outweigh the costs. Follow the simple rules of applying the setup and learn from these common mistakes to help you analyze profitable opportunities in the currency market
![Forex Trading -- Gartley Pattern and live example [Video Explanation]](https://lh3.googleusercontent.com/blogger_img_proxy/AEn0k_sEgQMYzvtce7JQFyrTDfaavjG_K10WOZbDQDzUH8krl-yDHxOSQIXqFDKbh5DA8BKHhzS-d5W21YtytTHTGvgo0TVtSIx_5pBGgvIXVDAQPmg)


![Forex Trading -- Gartley Pattern and live example [Video Explanation]](https://lh3.googleusercontent.com/blogger_img_proxy/AEn0k_tivWKwruFJn3oIdAM82FN7ODSXTZXNUKKV0FQ41o7GbtBYz41Nuc6aBe3na6nHp0Ck2WLcSUmMZ9P0-oFdHuq2fqyuzacXzJH68l5Ox4vUfHPvlQxuK2UqGUDPXzA=w72-h72-p-k-no-nu)

Leave a Comment